
As proposed by Hendrik W. Bode a Bode Plot is simply a graphical representation used to design and analyze any control system. Here a logarithmic scale is used which helps in the graphical representation of frequency response of any system.
In these plots we plot separate magnitude and phase plots on the logarithmic scale for logarithmic value of frequencies. The basic difference between the polar plots and these plots is that in polar plots normal linear scales are used and in bode plots we use logarithmic scale.
By using these plots we represent any sinusoidal transfer function by two different plots. One of the plots is of magnitude versus frequency and the other one of phase angle vs frequency response of the system.
The detailed description of the magnitude and phase plot is discussed.
Magnitude Plot
Here the logarithmic scale values of magnitude versus logarithmic values of frequency are plotted. The magnitude of any transfer function G(s)H(s) is found as
The plot for logarithmic values of magnitude on the log axis is below.

Phase Plot
In this the logarithmic values of frequencies and the phase angle is plotted on log scale. The basic scale for representing these phase plots is below.

In order to plot these magnitude and phase plots semi-log papers are used. They have one linear axis and the other one is the logarithmic axis.
Steps for plotting Bode Plot
- For any given open loop transfer function G(s)H(s) replace s with j⍵ so that the transfer function is now represented in frequency domain.
- Then we calculate the magnitude in decibels by formula
- Therefore, the phase angle in degrees for phase plot is calculated as

- Lastly we plot magnitude and phase plot for different values of ⍵ from 0 to ∞.
- Then system gain is calculated as
- Since, the value of k is always constant the magnitude will also be constant for different values of ⍵ from 0 to ∞.

Then we have, for K>1 straight line is above 0dB
Also for K<1 straight line is below 0dB
Approximation of Bode Plot
If poles and zeros are not located at origin then the transfer function will be

Approximation: T >> 1. so, we can neglect 1.

Also due to the Approximation: T << 1. so, we can neglect T.
At a point both meet so equal i.e a time will come hence both approx become equal
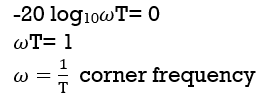
At this frequency both the cases are equal


When we increase the value of in approximation 2 and decrease the of approximation 1 so a RT comes when both cases are equal and hence for that value of where both approximations are equal gives max. error we found above and is equal to 3dB
Then at corner frequency we have max error of -3dB
Interested in learning about similar topics? Here are a few hand-picked blogs for you!