
Overview:
When the changes in one variable are associated or followed by change in the other, therefore we say that there is a correlation between the two.
Therefore, such types of data connecting two variables is called a bivariate population.
If an increase or decrease in the values of one variable corresponds to an increase or decrease in the other.In other words, if one value increases the other also increases.
Therefore, the corr. is said to be positive.
In other case, If the increase (or decrease) in one corresponds to the decrease (or increase) in the other, then it is said to be negative. Similarly, If there is no relationship indicated between the variables, they are said to be independent or uncorrelated.
When two variables are related in such a way that change in the value of one variable affects the value of the other variable, these two variables are said to be correlated and there is corr. between two variables.
Example- Height and weight of the people in a group.
The correlation is said to be perfect if two variables vary in such a way that their ratio is always constant. or in other words, if one variable is increasing or decreasing constantly then these two variables will be in perfect correlation.
Scatter diagram:


Here note that in order to obtain a measure of relationship between the two variables, we plot their corresponding values on the graph, taking one of the variables along the x-axis and the other along the y-axis.
Here note that Corr. measures the nature and strength of relationship between two variables. it lies between +1 to -1.
Therefore, a corr. of +1 indicates a perfect positive corr. between two variables.
Note that, A zero corr. indicates that there is no relationship between the variables. A corr. of -1 indicates a perfect negative.
Definition
“Corr. analysis deals with the association between two or more variables.” In other words, “Corr. is an analysis of the co-variation between two variables.”
Methods of computing coefficient of corr.

1. Scatter diagram method–
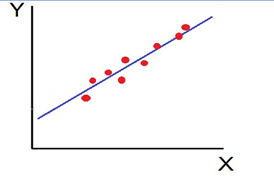
It is the simplest method to study corr. between two variables. therefore, The correlations of two variables are plotted in the graph in the form of dots thereby obtaining as many points as the number of observations.
Hence, the degree of corr. is ascertained by looking at the scattered points over the charts.
Note that, the more the points plotted are scattered over the chart, the lesser is the degree of corr. between the variables. Similarly, the more the points plotted are closer to the line, the higher is the degree of corr.
Here note that the degree of corr. is denoted by “r”.
Perfect positive corr. (r = +1) – All the points plotted on the straight line rising from left to right. see the figure below

Similarly, perfect negative corr. (r=-1) – all the points plotted on the straight line falling from left to right

Similarly, High Degree of +Ve Correlation (r= + High): all the points plotted close to the straight line rising from left to right
Similarly, high Degree of –Ve Corr. (r= – High) – all the points plotted close to the straight line falling from left to right.

Similarly, Low degree of +Ve Corr. (r= + Low): all the points are highly scattered to the straight line rising from left to right

Similarly, low Degree of –Ve Corr. (r= – Low): all the points are highly scattered to the straight line falling from left to right

Similarly, no Corr. (r= 0) – all the points are scatter over the graph and do not show any pattern

Hence, we widely use the Karl Pearson’s Coefficient of Corr. to calculate the degree and direction of the relationship between linear related variables. The coefficient of corr. is denoted by “r”.
Coefficient of Corr.
Karl Pearson’s coefficient of corr.–
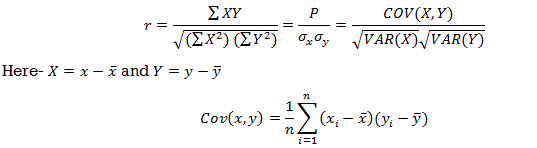
Here note that-
1. Corr. coefficient always lies between -1 and +1.
2. Corr. coefficient is independent of change of origin and scale.
3. If the two variables are independent, therefore, we say that the corr. coefficient between them is zero.
| Correlation coefficient | Type of correlation |
| +1 | Perfect positive correlation |
| -1 | Perfect negative correlation |
| 0.25 | Weak positive correlation |
| 0.75 | Strong positive correlation |
| -0.25 | Weak negative correlation |
| -0.75 | Strong negative correlation |
| 0 | No correlation |
Example: Find the correlation coefficient between Age and weight of the data-
| Age | 30 | 44 | 45 | 43 | 34 | 44 |
| Weight | 56 | 55 | 60 | 64 | 62 | 63 |
Solution:

Karl Pearson’s coefficient of correlation-

The correlation coefficient here is 0.27.which is the positive correlation (weak positive correlation), it indicates that as age increases, the weight also increase.
Short-cut method to calculate correlation coefficient-

Example: Find the correlation coefficient between the values X and Y of the dataset given below by using short-cut method-
| X | 10 | 20 | 30 | 40 | 50 |
| Y | 90 | 85 | 80 | 60 | 45 |
Solution:

By using short-cut method to calculate correlation coefficient,
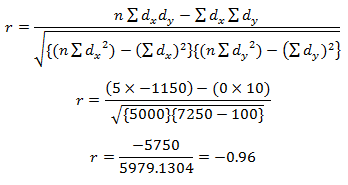
Therefore, We can say that there is a negative correlation between the two.
Interested in learning about similar topics? Here are a few hand-picked blogs for you!
What is Jacobian? https://www.minibar.cz/