Unit - 2
Project Planning and Scheduling
Following are a few reasons for creating a WBS in a project:
How to create Break down structure?
Below are the steps required to create a working exploded view from scratch.
Step 1: Bring your team together to identify project deliverables and by-products. This includes project managers and subject matter experts.
Step 2: Gather the required documents such as the project charter, project scope statement, project scope management plan.
Step 3: Identify the key deliverables of the project. These should be at the second level of the WBS. Key deliverables are essential to the completion of the project and are carried out by an independent team. That is, the same team does not work to complete another deliverable.
Step 4: Divide the main deliverables into smaller parts of the work (work packages) with the help of experts in the subject area. In other words, identify the work required to complete each deliverable.
Step 5: Create a WBS dictionary. This is a document that contains definitions and scopes for the various elements of the working exploded view. The WBS dictionary contains information such as the name and ID of the work package, the name of the assigned person, the due date, and the estimated cost. This gives the team a better understanding of the work package.
Step 6. You can create a WBS using a variety of formats, including text-based work breakdowns, tabular structures, or more visual formats such as flowcharts. When you're done, share it with your team. Creately's working exploded view can be quickly shared with other members of the team using secure sharing links. Sharing allows you to collaborate in real time.
Construction
The goals of WBS are:
Benefits of Work Breakdown Structure
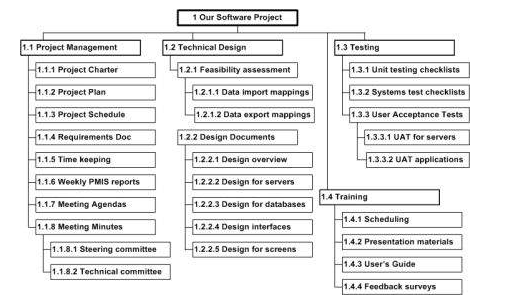
WBS Diagram
In a WBS diagram, the project scope is graphically expressed. Usually, the diagram starts with a graphic object or a box at the top, which represents the entire project.
Components for Break down structure
Below is the weather of the working exploded view and therefore the general terms you'll encounter when creating it.
Working Package: These are rock bottom parts of the working exploded view. They define the work, duration, and price of the tasks that require to be performed to finish the deliverable. don't believe other working packages and must not exceed 10 days to finish.
Deliverables: Activity or product achievements or measurable outcomes created at the top of every milestone.
Then, there are sub-components under the box. These boxes represent the deliverables of the project.
Under each deliverable, there are sub-elements listed. These sub-elements are the activities that should be performed in order to achieve the deliverables.
Although most of the WBS diagrams are designed based on the deliveries, some WBS are created based on the project phases.
WBS is the input for Gantt charts, a tool that is used for project management purpose. Gantt chart is used for tracking the progression of the tasks derived by WBS.
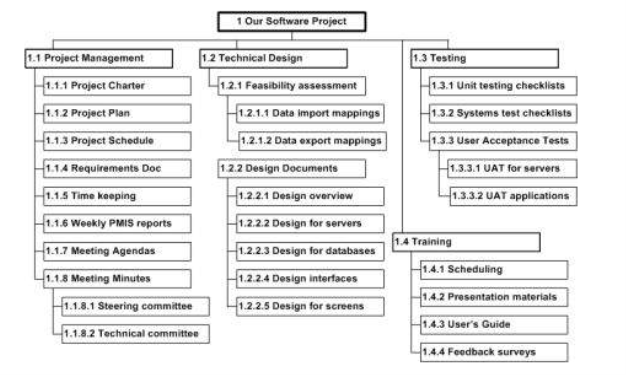
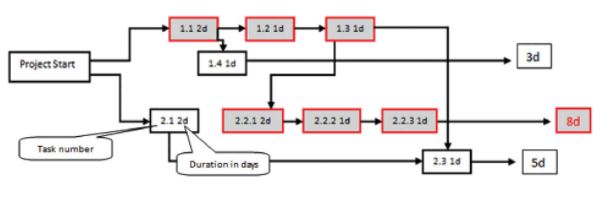
Sample of WBS diagram
Gantt Chart
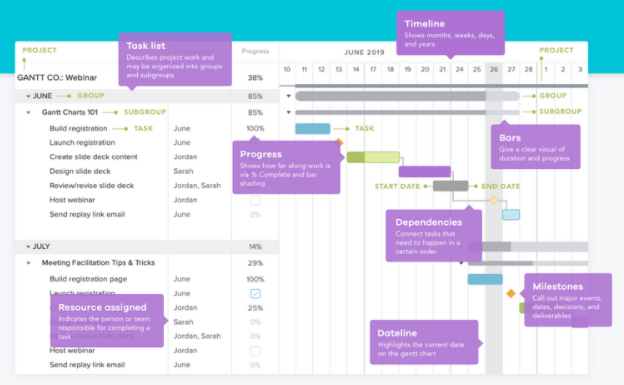
A Gantt chart is a horizontal bar chart that visually represents a project plan over time. Modern Gantt charts typically show you the status of—as well as who is responsible for—each task in the project.
The components of Gantt chart are:
Task list: Runs vertically down the left of the gantt chart to describe project work and may be organized into groups and subgroups
Timeline: Runs horizontally across the top of the gantt chart and shows months, weeks, days, and years
Dateline: A vertical line that highlights the current date on the gantt chart
Bars: Horizontal markers on the right side of the gantt chart that represent tasks and show progress, duration, and start and end dates
Milestones: Yellow diamonds that call out major events, dates, decisions, and deliverables
Dependencies: Light gray lines that connect tasks that need to happen in a certain order
Progress: Shows how far along work is and may be indicated by % Complete and/or bar shading
Resource assigned: Indicates the person or team responsible for completing a task
Gantt Example
Gantt charts are useful in any industry some of them include:
The Benefits of Gantt Charts
Limitations
Network Planning
Network Planning approach
The address the problem of given a location to provide connectivity using a set of nodes
Determine the minimum cost network topology, considering the hardware, the antenna type and orientation, and radio transmission powers, such that the balance between power, interference, and performance (e.g., in term of throughput or delay) are satisfied.
The goal of network planning is to interconnect different equipments in order to share resources among several users.
When planning a network, aim is to achieve a given objective. For example, the network planner may want to minimize the cost, minimize the delay, maximize the throughput.
Network Analysis:
Network analysis is a system which plans the projects by analyzing the project activities.
Projects are broken down into individual tasks or activities, which are arranged in logical sequence. It is also decided that which tasks will be performed simultaneously and which other sequentially.
A network diagram is prepared, which presents visually the relationship between all the activities involved and the cost for different activities.
Network analysis helps designing, planning, coordinating, controlling and in decision-making in order to accomplish the project economically in the minimum available time with the limited available resources.
The network analysis fulfils the objectives of reducing total time, cost, idle resources, interruptions and conflicts.
Managerial applications of network analysis are as follows:
Network techniques:
What is a network analysis method?
Network analysis methods are a group of special analysis methods used when you need to analyze and optimize a network of interconnected related elements that have some connection to each other.
What is the method of network analysis?
Network analysis techniques are used in project management, where elements are the main activity of a project in a mutual time relationship. Another possibility of their use is in the areas of logistics and transportation, where the elements are central and the dependencies are spatial (figuratively temporal). Network analysis methods focus on calculation between elements or optimization of the critical path.
A. Number of network techniques have been developed in recent times:
PERT- Programme Evaluation and Review Technique
The PERT method (program evaluation and review technique) is one among the quality methods of network analysis. The PERT method may be a generalization of the critical path method (CPM). PERT is employed to manage complex actions of a probabilistic nature. Here, the duration of every sub activity is known as a variate with a probability distribution. Experience has shown that the beta distribution is really the simplest explanation because it better reflects the variability of operating conditions (such as mining operations).
Key Takeaways:
CPM- Critical Path Method
The critical path method (CPM) is one of the basic deterministic methods of network analysis. Its purpose is to determine the duration of the project based on the length of the critical path, which is a sequence of interdependent activities with minimal floats. CPM facilitates effective time adjustment of individual interconnected activities within a project.
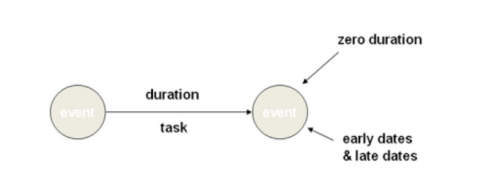
AOA (Activity on Arrow)
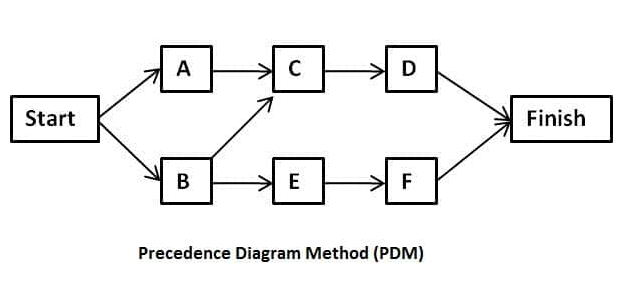
A project network illustrates the relationships between activities / tasks in
the project. Showing the activities as nodes or on arrows between event nodes are two main ways to draw those relationships.
Two types of Network Logic: -
With activities on arrow (AOA) diagrams,
Arcs = only indicate activities
• Nodes = events (activity start or end)
Critical Path

The steps to calculate the early start dates of subsequent activities, assuming finish-start relationships:
Critical Path
The steps to calculate the early start dates of subsequent activities, assuming finish-start relationships:
Float
Float, sometimes called slack, which is the amount of time on an activity, network path, or project that can be delayed from the early start without changing the completion date of the project.
Type of Floats
Precedence Network Analysis
Type
The PDM uses four dependencies:
This dependency is also known as hard logic. You cannot avoid it. Starting the next activity depends on it.
2. Discretionary Dependency
This dependency is also known as preferential or soft logic, it plays a role in optimizing resources.
Here, you can change the sequence of activities as per your preferred logic.
3. External Dependency
The project management team has no control over an external dependency.
4. Internal Dependency
These are dependencies are within the control of your project or organization.
Dependency Relation
The Precedence Diagramming Method uses four relationships:
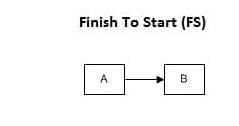
Finish to Start (FS)
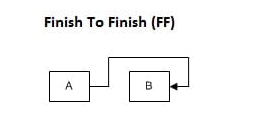
Finish to Finish (FF)
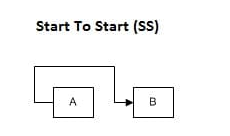
Start to Start (SS)
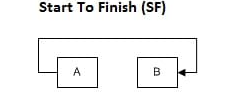
Start to Finish (SF)
Finish to Start (FS)
Here, the next activity cannot start until the first is complete. This is the most common relationship in PDM.
Finish to Finish (FF)
Here, you cannot complete the next activity until the first is finished. Put simply, both activities should be finished simultaneously.
Start to Start (SS)
Here, the next activity cannot be started until the first starts. Both activities should start simultaneously.
Start to Finish (SF)
Here, you cannot finish the next activity until the first starts.
To Draw a Precedence Diagram
To draw a PDM, break your Work Breakdown Structure down to the activity level. Then create a table, list all activities, and sequence the activities. The next step is to add relationships to each activity. You will add what activity comes next. Finally, draw the diagram.
Benefits of Precedence Diagramming Method
This method offers many benefits to project management:
PERT Analysis
The method was developed by the US Navy in 1957 on the Polaris nuclear submarine project. Program Evaluation and Review Technique (PERT) is a method used to examine the tasked that are in a schedule and determine a variation of the Critical Path Method (CPM). It analyzes the time required to complete each task and its associated dependencies to determine the minimum time to complete a project. It estimates the shortest possible time each activity will take, the most likely length of time, and the longest time that might be taken if the activity takes longer than expected. To conduct PERT Analysis, three-time estimates are obtained (optimistic, pessimistic, and most likely) for every activity along the Critical Path. Then use those estimates in the formula below to calculate how much time for each project stage:
Formula = (P+4M+O)/6
Optimistic Time (O): the minimum possible time required to accomplish a task, assuming everything proceeds better than is normally expected.
Pessimistic Time (P): the maximum possible time required to accomplish a task, assuming everything goes wrong (excluding major catastrophes).
Most likely Time (M): the best estimate of the time required to accomplish a task, assuming everything proceeds as normal.
References:


