UNIT 3
Demand and supply analysis
- Demand refers to desire of a consumer to purchase goods and services and ability to pay a price for the goods and services purchased. No business will produce anything, without consumers demand
- Demand is an important factor for expansion and economic growth.
- For instance, if the price of goods or services increases will lead to decrease in the demand of goods and services by the consumer, and vice versa
Ordinarily, DEMAND means a desire or want for something. In economics, however, demand means much more than that. Economics attach a special meaning to the concept of demand i.e. ‘Demand is the desire or want backed up by money.’ It means effective desire or want for a commodity, which is backed up the purchasing power and willingness to pay for it.
Demand, in economics, means effective demand for a commodity. It requires three conditions on the part of consumer.
- Desire for a commodity
- Capacity to buy or purchased
- Willingness to pay its price.
In short,
Demand = Desire + Ability to pay + Willingness to spend
Demand is always related to Price & Time. Demand is not the absolute term. It is a relative concept. Demand for a commodity should always have a reference to Price & Time.
 For e.g. – Price Grapes for house hold at a price of Rs. 20/- per Kg., Rs. 10/- per Kg
 Time per day, per month, per year
Definition:
The Demand for a commodity refers to the quantity of a commodity that a person is willing to buy at different prices during period of time.
Key takeaways –
- Demand describes the way that changes in the quantity of a good or service demanded by consumers affects its price in the market.
They are as follows:
Price of the product:
- Price plays an important factor to make decision if all other factor remains constant.
- Increase in demand follows reduction in price and similarly, decrease in cost of goods and services will increase the demand
Income of consumer
- Income and demand is directly proportional
- When the income rises, the demand for the good and services increases. When the income fall, the demand will decrease simultaneously
Price of related goods and services
- Complementary products – complementary goods are goods that are used together. When the price of a particular item changes, it changes the demand of that item as well as the complement. Example: Increase in the price of car will reduce the demand for petrol.
- Substitute Product –Substitute products are those products which are used for same purpose. Example: Price of tea increases then the demand for coffee increases and the demand for tea decreases.
Consumer Expectations
- When consumer expect value of something will increase , they demand more of it
- For ex, if the vehicle price is expected to increase, people buy more
Number of Buyers in the Market
- The number of buyers plays a major effect on the total demand
- As the number of buyer increases, the demand rises and vice versa
Key takeaways –
- The determinants of demand are factors that cause fluctuations in the economic demand for a product or a service.
The law of demand states that all other factors remain constant or equal, an increase in the price causes a decrease in the quantity demanded and a decrease in goods or services price leads to increase in the quantity demanded. Thus it expresses an inverse relationship between price and demand.
For example, at Rs 70 per kg consumer may demand 2 kg of apple. On the other hand, the price rises to 100/- per kg then he may demand 1 kg of apple
Assumption of law of demand
- No change in the income
- No change in size population
- No change in price of related goods
- No change in consumers taste, preferences, etc
- No expectation of a price change in future
- No change in climate conditions
Given these assumption, the law of demand is explained in the below table –
Price(Rs) | Quantity demanded |
10 | 10 |
8 | 20 |
6 | 30 |
4 | 40 |
2 | 50 |
|
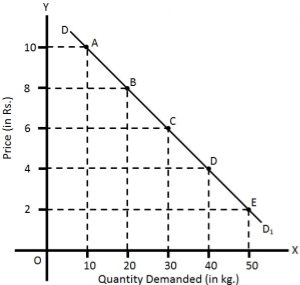
The above table shows that when the price of apple, is Rs. 10 per kg, 10 kg are demanded. If the price falls to Rs.8, the demand increases to 20 kg. Similarly, when the price declines to Rs 2, the demand increases to 50 kg. This indicates the inverse relation between price and demand.
Also, in the above figure the demand curve slopes downwards as the price decreases, the quantity demanded increases.
Exception of law of demand
Under the following circumstances, consumers buy more when the price of a commodity rises, and less when price falls which leads to upward sloping demand curve.
- Giffen goods are those products where the demand increases with the increase in price. For example, necessities products like rice, wheat. Lower incomes group will spend less on superior foods (like meat) to buy more rice, wheat etc.
- In anticipation of war, consumers start buying even when the prices are high due to the fear of shortage.
- During a depression, the prices of products are low still the demand for those products is also less.
- the law of demand is not applicable on necessities of life such as food, cloth etc
Key takeaways –
- The law of demand is a fundamental principle of economics which states that at a higher price consumers will demand a lower quantity of a good
Under law of demand, price falls and demand rises, vice versa. But how much the quantity rise or fall for a given change in price is not determined in law of demand. So the concept of elasticity of demand is derived to know how much quantity demanded changes for a change in the price of goods or services.
“The elasticity (or responsiveness) of demand in a market is great or small according as the amount demanded increases much or little for a given fall in price, and diminishes much or little for a given rise in price”. – Dr. Marshall.
Elasticity means sensitivity of demand to the change in price.
The formula for calculating elasticity of demand is:
EP = proportional changes in quantity demanded/proportional changes in price
3.4.1 Price Elasticity of Demand - Meaning, Types, Measurement, Uses and Significance
The price of elasticity demand is the change in the quantity demanded to the change in the price of the commodity
Dr Marshall has defined price elasticity of demand as below
"Price elasticity of demand is a ratio of proportionate changes in the quantity demanded of a commodity to a given proportionate change in its price."
Thus, pride elasticity is responsiveness of change in demand due to a change in price only. Other factors such as income, population, tastes, habits, fashions, prices of substitute and complementary goods are assumed to be constant.
Formula –
Ep = percentage change in quantity demanded/percentage change in price
Types
There are 5 types of price elasticity of demand given below
- Perfectly elastic demand
- A small change in price results to major change in demand is said to be perfectly elastic demand
- The demand curve in perfectly elastic demand represent horizontal straight line
- Ep = infinity
|
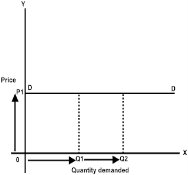
From the above figure, we can see at price P1 consumers are ready to buy as much quantity as they want. A slight increase in price may result to fall in demand to zero.
2. Perfectly inelastic demand
- When there is no change in the demand of the commodity with the change in price is said to be perfectly inelastic demand
- The demand curve in perfectly elastic demand represent Vertical straight line
- Ep = zero
|
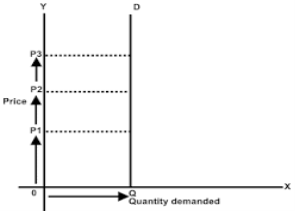
From the above fig, we can see that price is rising from P1 to P2 to P3, but there is no change in the demand. This cannot happen in practical situation. But, in essential goods such as salt, with the change in price the demand does not change.
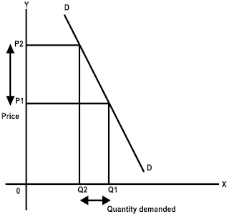
3. Relatively elastic demand
- When the proportionate change in demand is greater than the proportionate change in price of a product
- The value ranges between one to infinity (ep>1)
- Ex – a smaller change in flight price result in more demand for booking the flight tickets
|
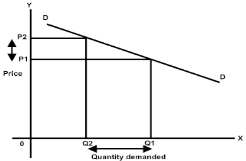

- From the above figure, it is observed that the percentage change in demand from Q2 to Q1 is larger than the percentage change in price from P2 to P1. Thus the demand curve is gradually sloping downwards
4. Relatively inelastic demand
- When the percentage change in demand is less than the percentage change in price
- The value ranges between zero to one (ep<1)
- Ex – cloths, drinks, food, oil , as the change in price does not affect the quantity demanded.
|
- From the above figure, it is interpreted that the proportionate change in demand from Q2 to Q1 is less than the proportionate change in price from P2 to P1. Thus the demand cure rapidly sloping down.
5. Unitary elastic demand
- When the percentage change in quantity demanded in equal to the percentage change in price of the commodity
- The value is equal to one (ep=1)
|
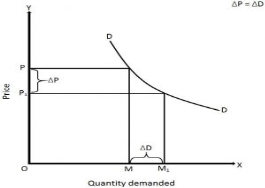
In the above figure we can observe that proportionate change in price from P to P1 cause the same proportionate change in price from M to M1
Measurements
1. Ratio or Proportional Method
This ratio method of measuring elasticity of demand is also known as Arithmetic or Percentage method. This method is developed by Dr. Marshall. In this method percentage change in quantity demanded and divide it by percentage change in the price of the commodity.
Example
Price of X | Demand (Units) |
200 | 1000 |
100 | 1500 |
In the above table we can see the price of commodity X falls from Rs. 200/- to Rs. 100/- and quantity demanded increases from 1000 units to 1500 units. Here percentage change in demand is 50, whereas percentage change in price is also 50. Therefore, 50%, / 50% = 1, which, means Ed is unitary or one.
2. Total expenditure method
In this method, statistics of total expenditure is used to find out elasticity of demand. Total expenditure at the original price and total expenditure at the new price is compared with each other, and we come to know the elasticity of demand.
When price falls or rises, total expenditure does not change or remains constant, demand is unitary elastic.
When price falls, total expenditure increases or price rises and total expenditure decreases, demand is elastic or elasticity of demand is greater than one.
Example
Price (Rs.) | Demand (Units) | Total Outlay (Rs.) | Elasticity of Demand | |
A | 10 8 | 12 15 | 120 120 | Unitary or 1 |
B | 10 8 | 12 20 | 120 160 | Elastic or > 1 |
C | 10 8 | 12 14 | 120 112 | Inelastic or < 2 |
3. Point elasticity method
The price elasticity of demand also is measured at any point on the demand curve. It is noted that demand is unitary at midpoint of demand curve that total revenue is maximum at this point. Any point above unitary point shows elasticity is greater than one (means price relation in this point leads to an increase in the total revenue.
Any point below midpoint shows elasticity is less than one means price relation in these point lead to reduction in the total revenue.
Uses and significance
1. Monopoly and Elasticity of Demand:
The objective of a seller in monopoly market is profit maximization. Since he is a single seller in monopoly, market having total control over supply and price, he can take decisions about price policy and get more profit. If demand is inelastic for the product sold by monopolist, he will raise the price of that commodity and earn more profit.
2. Taxation Policy and Elasticity of Demand:
The concept of Price Elasticity of Demand is useful to the government in the determination of taxation policy. The finance minister considers the Elasticity of Demand, while selecting goods and services for taxation. If government wants more revenue, those goods will be taxed more, for which demand is inelastic. Therefore, generally heavy taxes are imposed on goods like cigarettes, liquors and actual goods for which demand is inelastic.
3. Fixation of Wages and Elasticity of Demand:
The concept of Elasticity of Demand is useful to trade unions in collective bargaining, for wage determination. When trade union leaders know that demand for their product is inelastic, they will insist for more wages to workers.
4. International Trade and Elasticity of Demand:
The concept of Elasticity of Demand is useful to determine norms and conditions in international trade. The countries exporting commodities for which demand is inelastic can raise their prices. For instance, Organization of Petroleum Exporting Countries (OPEC) has increased the prices of oil several times. The concept is also useful in formulating export and import policy of a country.
5. Public Utilities:
In case of public utilities like railways which have an inelastic demand, to avoid consumers exploitation government can either subsidies or nationalize them. This shows need of government monopoly.
3.4.2 Income Elasticity of Demand-Meaning and Types
The income elasticity is measures the sensitivity of quantity demanded for a goods or services to a change in consumer’s income
 Formula - Percentage change in the quantity demanded
Percentage change in the consumer’s income
Types
- Positive income elasticity of demand -
When a proportionate change in the income of a consumer increases the demand for a product and vice versa, income elasticity of demand is said to be positive. In case of normal goods, the income elasticity of demand is generally found positive.
|
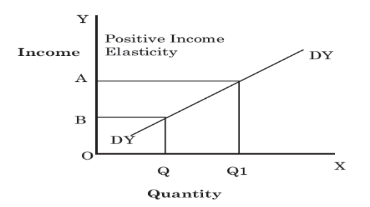
In Figure, DYDY is the curve representing positive income elasticity of demand. The curve is sloping upwards from left to the right, which shows an increase in demand (OQ to OQ1) as a result of rise in income (OB to OA).
2. Negative income elasticity of demand –
When a proportionate change in the income of a consumer results in a fall in the demand for a product and vice versa, income elasticity of demand is said to be negative. In case of inferior goods, the income elasticity of demand is generally found negative.
|
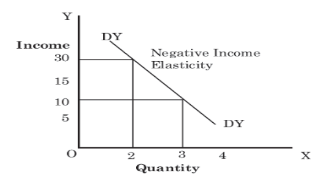
In Figure, DYDY is the curve representing negative income elasticity of demand. The curve is sloping downwards from left to the right, which shows a decrease in the demand as a result of a rise in income. As shown in Figure, with a rise in income from 10 to 30, the demand falls from 3 to 2.
3. Zero income elasticity of demand –
When a proportionate change in the income of a consumer does not bring any change in the demand for a product, income elasticity of demand is said to be zero. It generally occurs for utility goods such as salt, kerosene, electricity.
|
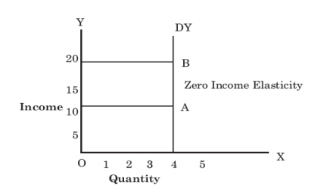
In Figure, DYDY is the curve representing zero income elasticity of demand. The curve is parallel to Y-axis that shows no change in the demand as a result of a rise in income. As shown in Figure, with a rise of income from 10 to 20, the demand remains the same i.e. 4.
3.4.3 Cross Elasticity of Demand-Meaning and Types
“The cross elasticity of demand is the proportional change in the quantity of X good demanded resulting from a given relative change in the price of a related good Y” Ferguson
It measures the percentage change in the quantity demanded of commodity X to the percentage change in the price of its substitute/complement Y
 Formula – proportionate change in quantity demanded of X
Proportionate change in the price of Y
Types
- Positive - When goods are substitute of each other then cross elasticity of demand is positive. In other words, when an increase in the price of Y leads to an increase in the demand of X. For instance, with the increase in price of tea, demand of coffee will increase.
|
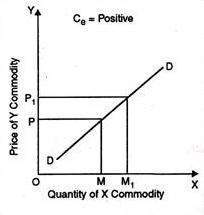
In the above figure, at price OP of Y-commodity, demand of X-commodity is OM. Now as price of Y commodity increases to OP1 demand of X-commodity increases to OM1 Thus, cross elasticity of demand is positive.
2. Negative - A proportionate increase in price of one commodity leads to a proportionate fall in the demand of another commodity because both are demanded jointly refers to negative cross elasticity of demand.
|
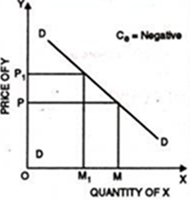
When the price of commodity increases from OP to OP1 quantity demanded falls from OM to OM1. Thus, cross elasticity of demand is negative.
3. Zero - Cross elasticity of demand is zero when two goods are not related to each other. For instance, increase in price of car does not effect the demand of cloth. Thus, cross elasticity of demand is zero.
|

Key takeaways
- Elastic demand is when a product or service's demanded quantity changes by a greater percentage than changes in price.
- The opposite of elastic demand is inelastic demand, which is when consumers buy largely the same quantity regardless of price.
- Cross elasticity of demand is the ratio of proportionate change in the quantity demanded of Y to a given proportionate change in the price of the related commodity X.
- Income elasticity of demand means the ratio of the percentage change in the quantity demanded to the percentage in income.
Supply is the willingness and ability of producers to produce goods and services and make it available to the consumers. The total amount of goods and services available for purchases at any specific price.
Definition: Supply is an economic term that refers to the amount of a given product or service that suppliers are willing to offer to consumers at a given price level at a given period.
Determinants
- Price of the product - The major determinants of the supply of a product is its price. Other factors remains the same, an increase in the price of a product increases its supply and vice versa. Producer expects increase profits so they increase the supply of product at higher price.
2. Cost of production - Cost of production and supply are inversely proportional to each other. This implies that suppliers do not supply products in the market when the cost of manufacturing is more than their market price.
3. Natural conditions – certain products supply is directly influenced by climatic conditions. For example, the supply of agricultural products increases when the monsoon comes well on time.
4. Transportation conditions - Better transport facilities result in an increase in the supply of goods. Transport is always a constraint to the supply of goods. This is because due to poor transport facilities goods are not available on time.
5. Taxation policies - Government’s tax policies also act as a regulating force in supply. The supply will decrease if the rates of taxes levied on goods are high. This is because overall productions costs are increased by high tax rate, which will make it difficult for suppliers to offer products in the market.
6. Production technique - The supply of goods also depends on the type of techniques used for production. Obsolete techniques result in low production, which further decreases the supply of goods.
7. Price of related goods - The prices of substitutes and complementary goods also determines the supply of a product to a large extent. For example, if the price of tea increases, farmers would tend to grow more tea than coffee. This would decrease the supply of tea in the market.
Law of supply
Law of supply states that all factors being constant, seller supply more in the rising price and supply less when the price decreases.
Definition
“Other things remaining unchanged, the supply of a commodity rises i.e., expands with a rise in its price and falls i.e., contracts with a fall in its price.
Assumption
- No change in income
- No change in technique of production
- No change in transport cost
- The price of other goods remain constant
- No change in government policies
- No speculation about future changes in the price of the product
- Fixed scale of production
Explanation of the law
Law of supply explained with the help of supply schedule and supply curve
Supply schedule
Supply schedule is the tabular representation of price and quantity supplied by the seller
|
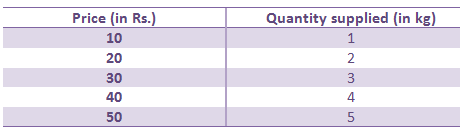
When the price was Rs 10, quantity supplied was 1kg. When the price started 3ising from Rs 20 to 50 to 40 so on, the quantity supplied by the seller increased from 2kg, 3 kg to 5kg respectively.
Thus the above table shows positive relation between price and quantity
Supply curve
The supply curve is a graphical representation of a supply schedule.
|
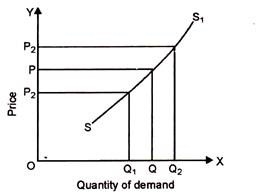
In the above figure, OX axis shows quantity of demand and OY axis shows price. When the price was at OP, supplier was supplying OQ quantity. When the price increases from OP to OP2 and then supply also increases from OQ to OQ2. Similarly, if price decreases from OP to OP1, then supply also decreases from OQ to OQ1.
In the above figure, we can see supply curve is sloping upward. The market supply rises with the rise in price.
Limitation of law of supply
- Price expectation in future- the seller expects the price to rise in future, and then he will sell less. In case the price will fall in future, then the seller will sell more which is against law of supply
- Fear of out of fashion – if the seller expects that the goods will be outdated in future, then he will sell the goods at low price
- Stock clearance sale – when the seller wants to store new stock, then he will sell old stock at discounted price.
- Perishable goods – these goods have short life time. The seller will sell the goods at any price
Key takeaways –
- Supply is the willingness and ability of producers to produce goods and services and make it available to the consumers.
- Law of supply states that all factors being constant, seller supply more in the rising price and supply less when the price decreases
Equilibrium is a situation in which opposing forces balance each other.
Market equilibrium is a situation in which:
- Quantity demanded equals quantity supplied at a single price called market (equilibrium) price (P*). Price adjusts when plans do not match.
- demand curve intersects supply curve, and
- The market just clears and there is no tendency to change since the price balances the plans of buyers and sellers.
- At the market equilibrium, the price accepted by producers for the last unit (marginal cost) is equivalent to the price the last consumer is willing and able to pay (marginal benefit).
The equilibrium price (P*) is the price at which the quantity demanded equals the quantity supplied. Price regulates buying and selling plans. Equilibrium quantity (Q*) is the amount bought and sold at the equilibrium price P*.
The interaction between buyers and sellers through price adjustment, which results in equilibrium quantity, determine the answer to “what to produce.”
"How we produce" is determined by profit seeking behavior and using resources efficiently (using the least-cost methods of production).
The answer to "for whom" question includes only those people willing and able to pay market price (P*).
Market equilibrium does not make everyone fully satisfied but it is efficient. (optimal but not perfect)
We will analyze the equilibrium using tables, diagrams and mathematical equations through the following example.
|
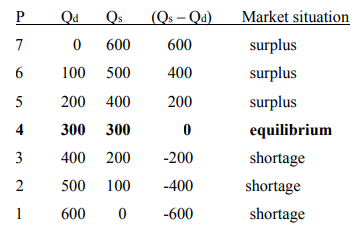
|
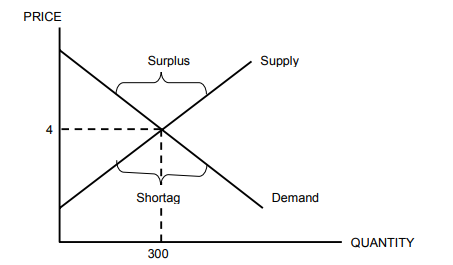
The market is at equilibrium (i.e., clear) at market price of P* = 4 and equilibrium quantity of Q* = Qd = Qs = 300 and there is no surpluses or shortages.
Whenever the market price is set above or below the equilibrium price, either a market surplus or a market shortage will emerge
Key takeaways –
- The equilibrium price (P*) is the price at which the quantity demanded equals the quantity supplied
References
- Business economics by H.L Ahuja
- Business economics application and analysis by Dr. Raj kumar
- Business economics by T Aryamala
- Business economics by SK Agarwal


